


 Market Data

$SHIB’s Solana launch adds a new trading venue
Sunrise announced $SHIB’s availability on Solana on Oct. 4, with the official Shiba Inu and Solana accounts also confirming the launch, according to Solana Compass. The analytics platform reported that the token became tradable through services including Raydium, Jupiter, and Phantom.
Solana Compass recorded 3,005 trades worth approximately $300,000 across 1,401 wallets during a five-minute window shortly after the announcement. Its early figures also showed about $514,000 in pool liquidity.
The launch gives $SHIB another venue for trading as its daily chart tests resistance. Nevertheless, the price recovery visible on TradingView began before the Oct. 4 announcement, with the token already climbing from its summer base through August and September.
For U.S. holders following the October setup, the technical reference here is Binance’s $SHIB/$USDT market. Its quoted levels reflect that trading pair, while execution prices on other exchanges or Solana trading venues may differ.
Shiba Inu holds above four daily moving averages
The daily TradingView chart shows the 20-day simple moving average at $0.00000571 and the 50-day average at $0.00000541. The 100-day average stands at $0.00000494, while the 200-day average sits at $0.00000530.
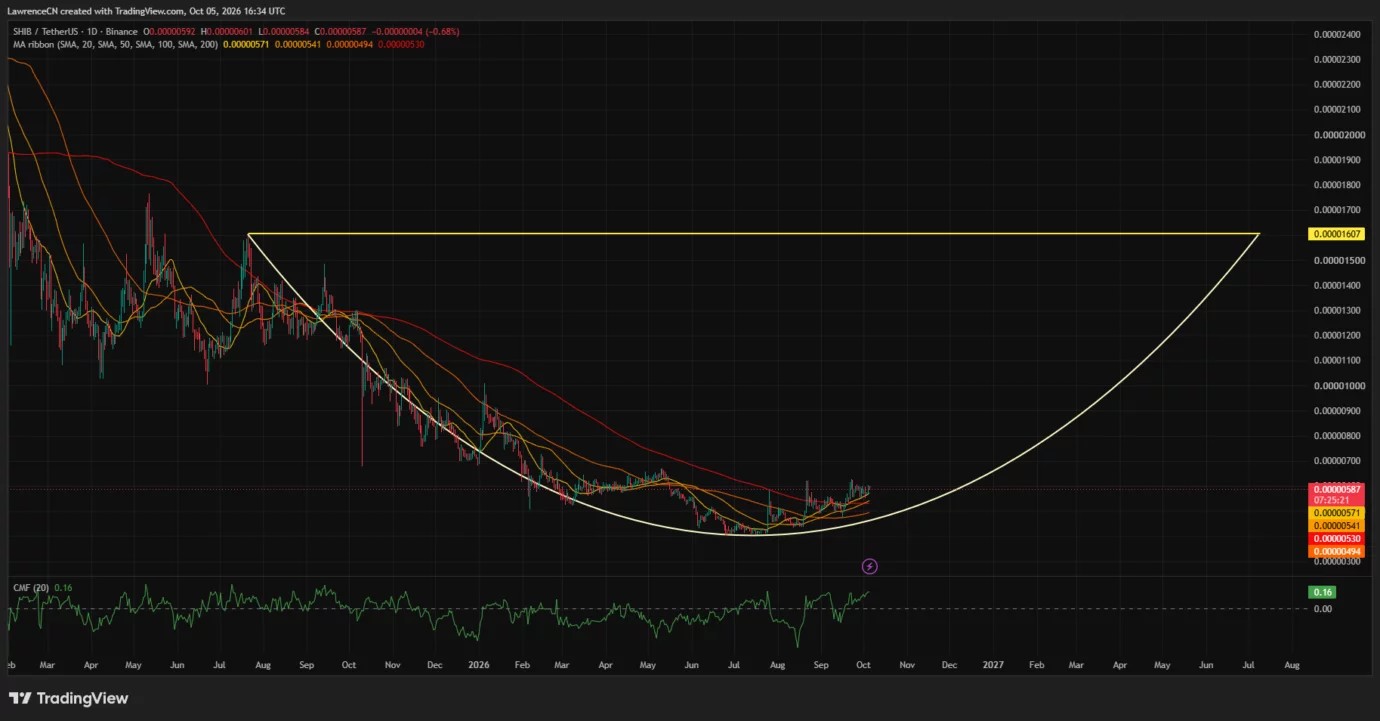
At $0.00000587, $SHIB trades approximately 2.8% above its 20-day average. The relatively small gap makes $0.00000571 the first moving-average level to watch if the token retreats from resistance.
Below that level, the 50-day and 200-day averages form a second reference zone between $0.00000530 and $0.00000541. A pullback into that area would surrender more of the recent advance and place price back among its longer-term trend measures.
The averages have not yet formed a fully bullish sequence. Although the 20-day average sits above the other three, the 100-day average remains below the 200-day average, reflecting the earlier decline.
Daily Chaikin Money Flow reads 0.16. Its positive reading supports the improving daily setup, although a sustained advance would still require price to clear the nearby highs.
The daily chart also contains a broad curved annotation running from the July 2025 peak, through the 2026 base, toward a horizontal level at $0.00001607. That level is roughly 174% above the latest price and belongs to a much larger potential recovery structure.
For October, the nearer $0.00000600–$0.00000630 area takes priority. $SHIB would need to overcome those levels before the distant upper boundary becomes relevant to the immediate outlook.
Weekly resistance at $0.00000596 remains the first hurdle
The weekly TradingView chart places $SHIB just below a Murrey Math resistance level at $0.00000596. The latest price is approximately 1.5% beneath that threshold, which closely overlaps the daily resistance area around $0.00000600.
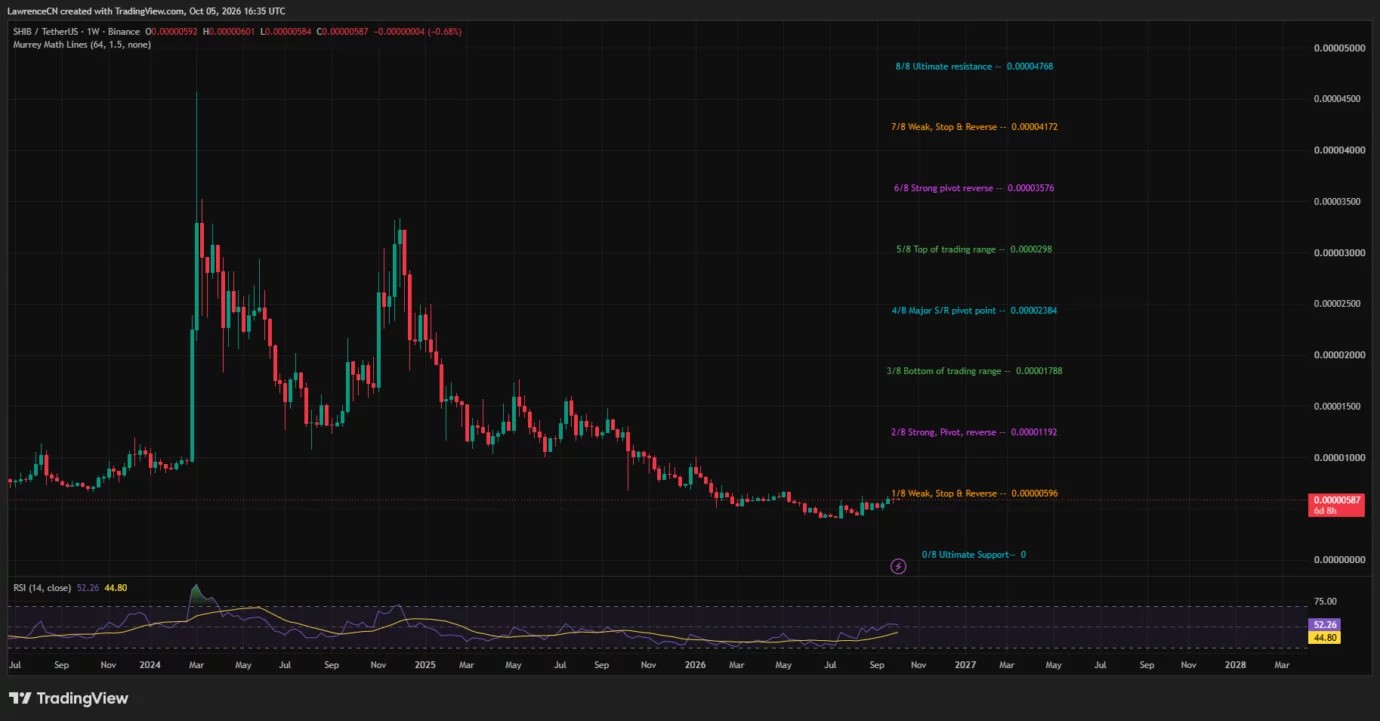
Weekly RSI stands at 52.26, above the neutral 50 line and its displayed average of 44.80. The reading marks firmer momentum than during the earlier decline, while remaining below the conventional overbought threshold of 70.
Price and momentum therefore present slightly different stages of recovery: RSI has moved above its midpoint, while $SHIB continues to test its first nearby weekly resistance.
A sustained move above $0.00000596–$0.00000600 would strengthen the near-term bullish case. Repeated rejection there would leave the token trading close to the same ceiling despite its improving indicators.
On X, market commentator Terrarmy described a potential daily ascending triangle and rising support on the 4-hour timeframe. The account also pointed to a possible test of longer-term descending resistance.
🔥🐕 $SHIB THE BIGGEST BREAKOUT COULD BE AHEAD! 🚀
Something interesting is forming on the $SHIB charts.
4H Chart: An ascending support trendline is forming, with price approaching a key resistance zone.
1D Chart: A potential ascending triangle structure is developing. A… pic.twitter.com/DfXv93hf11
— Terrarmy 🐋 (@terra_army) October 4, 2026
Terrarmy tied the bullish scenario to breakouts backed by strong volume and acknowledged the possibility of failed breakouts or support losses. The October outlook therefore remains conditional on $SHIB clearing resistance while preserving its recent higher lows.
October targets cluster around $0.00000610–$0.00000630
CoinGlass’s one-month liquidation heatmap shows overhead concentrations around $0.00000610 and $0.00000630. Both sit above the immediate $0.00000596–$0.00000600 resistance zone.
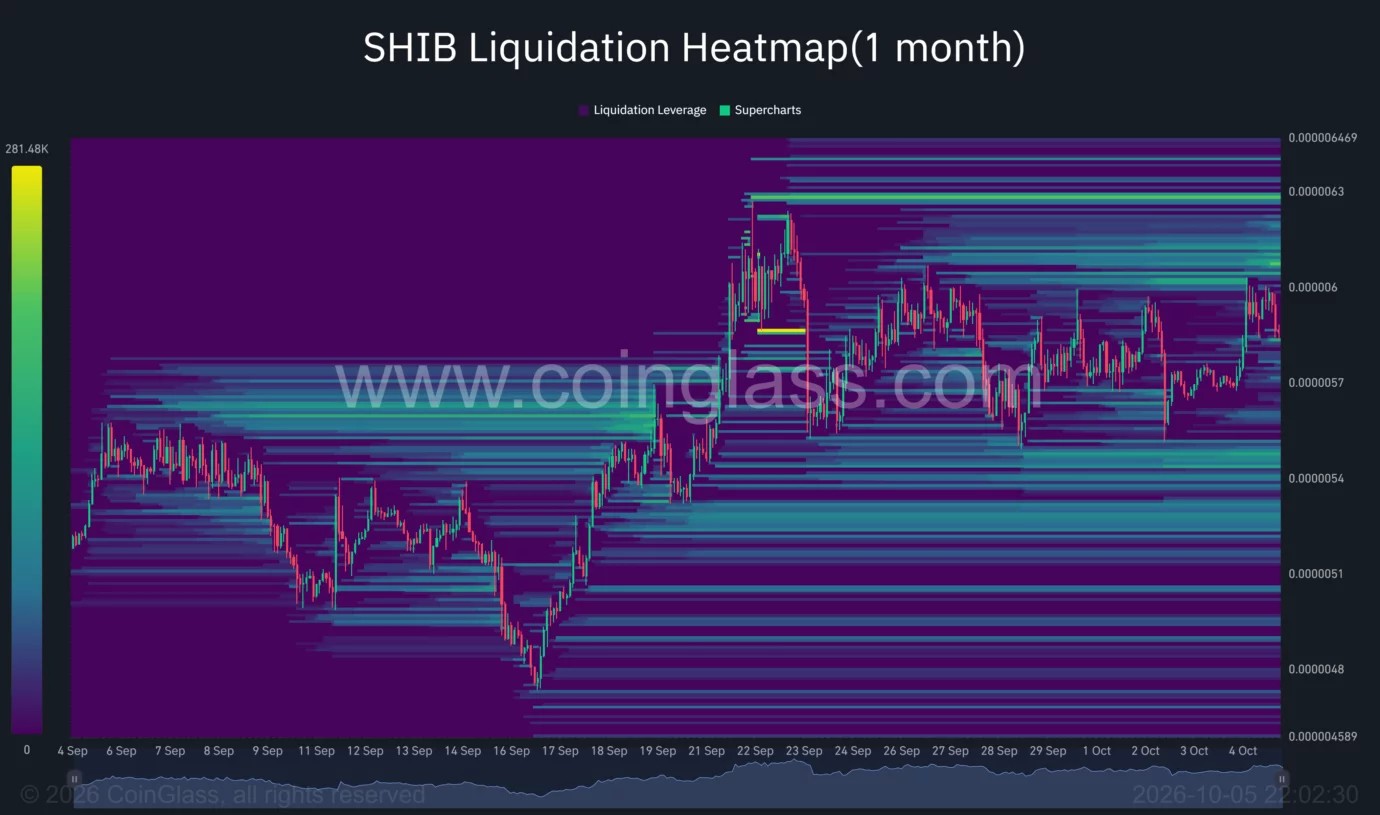
If $SHIB clears that first barrier and holds above it, $0.00000610 becomes the next nearby upside reference. The higher $0.00000630 area also lies close to the September peak visible on the heatmap.
From $0.00000587, moves to $0.00000610 and $0.00000630 would represent gains of approximately 3.9% and 7.3%, respectively. Reaching the upper zone would require $SHIB to push beyond several recent highs.
Below current prices, the heatmap shows liquidation concentrations around $0.00000545–$0.00000550 and another band near $0.00000530. Those areas broadly overlap the support region identified by the daily moving averages.
The short-term bullish scenario holds while $SHIB preserves its daily support and breaks through $0.00000600. A loss of $0.00000571 would put the lower $0.00000545–$0.00000550 area in focus, followed by $0.00000530–$0.00000541.
October’s immediate test is whether $SHIB can turn the $0.00000596–$0.00000600 ceiling into support. Until that happens, the charts show an improving recovery, with resistance still close overhead.
Read the full article here
