Close Menu
Political Risk WirePolitical Risk Wire
  • Home
  • News
  • Politics
  • Markets
    • Stocks
    • Futures & Commodities
    • Funds
    • Crypto
    • Forex
  • Economy
  • Finance
  • Fintech
  • Investing
  •  Videos
Trending Now

Binance BTC outflows hit highest since mid-2023 as whales deposit stablecoins

October 6, 2026

Helping my cousins through caregiving is giving me a new perspective. I’m finally giving myself credit for caring for my mom.

October 6, 2026

Amazon’s new Kindle case is an insult to my fellow lefties

October 6, 2026

Why BTC consolidates near recent highs?

October 6, 2026

I’m the CEO of Zocdoc. Here’s how long showers help me manage hectic days.

October 6, 2026
Facebook X (Twitter) Instagram
Facebook X (Twitter) Instagram Telegram
Login
Political Risk WirePolitical Risk Wire
 Market Data Newsletter
  • Home
  • News
  • Politics
  • Markets
    • Stocks
    • Futures & Commodities
    • Funds
    • Crypto
    • Forex
  • Economy
  • Finance
  • Fintech
  • Investing
  •  Videos
Political Risk WirePolitical Risk Wire
Home » Bitcoin hits a wall – the chart just challenged the $88,000 bull case
Crypto

Bitcoin hits a wall – the chart just challenged the $88,000 bull case

News RoomNews RoomApril 13, 20269 ViewsNo Comments
Facebook Twitter LinkedIn Reddit Telegram WhatsApp Pinterest Email
Facebook Twitter LinkedIn Pinterest Email

Just yesterday, CoinDesk reported that despite lingering war risks, analysts foresee bitcoin rallying to $88,000 and higher on the back of several crypto-specific factors, including bullish market flows.

But now, some 16 hours later, the price chart is saying: not so fast.

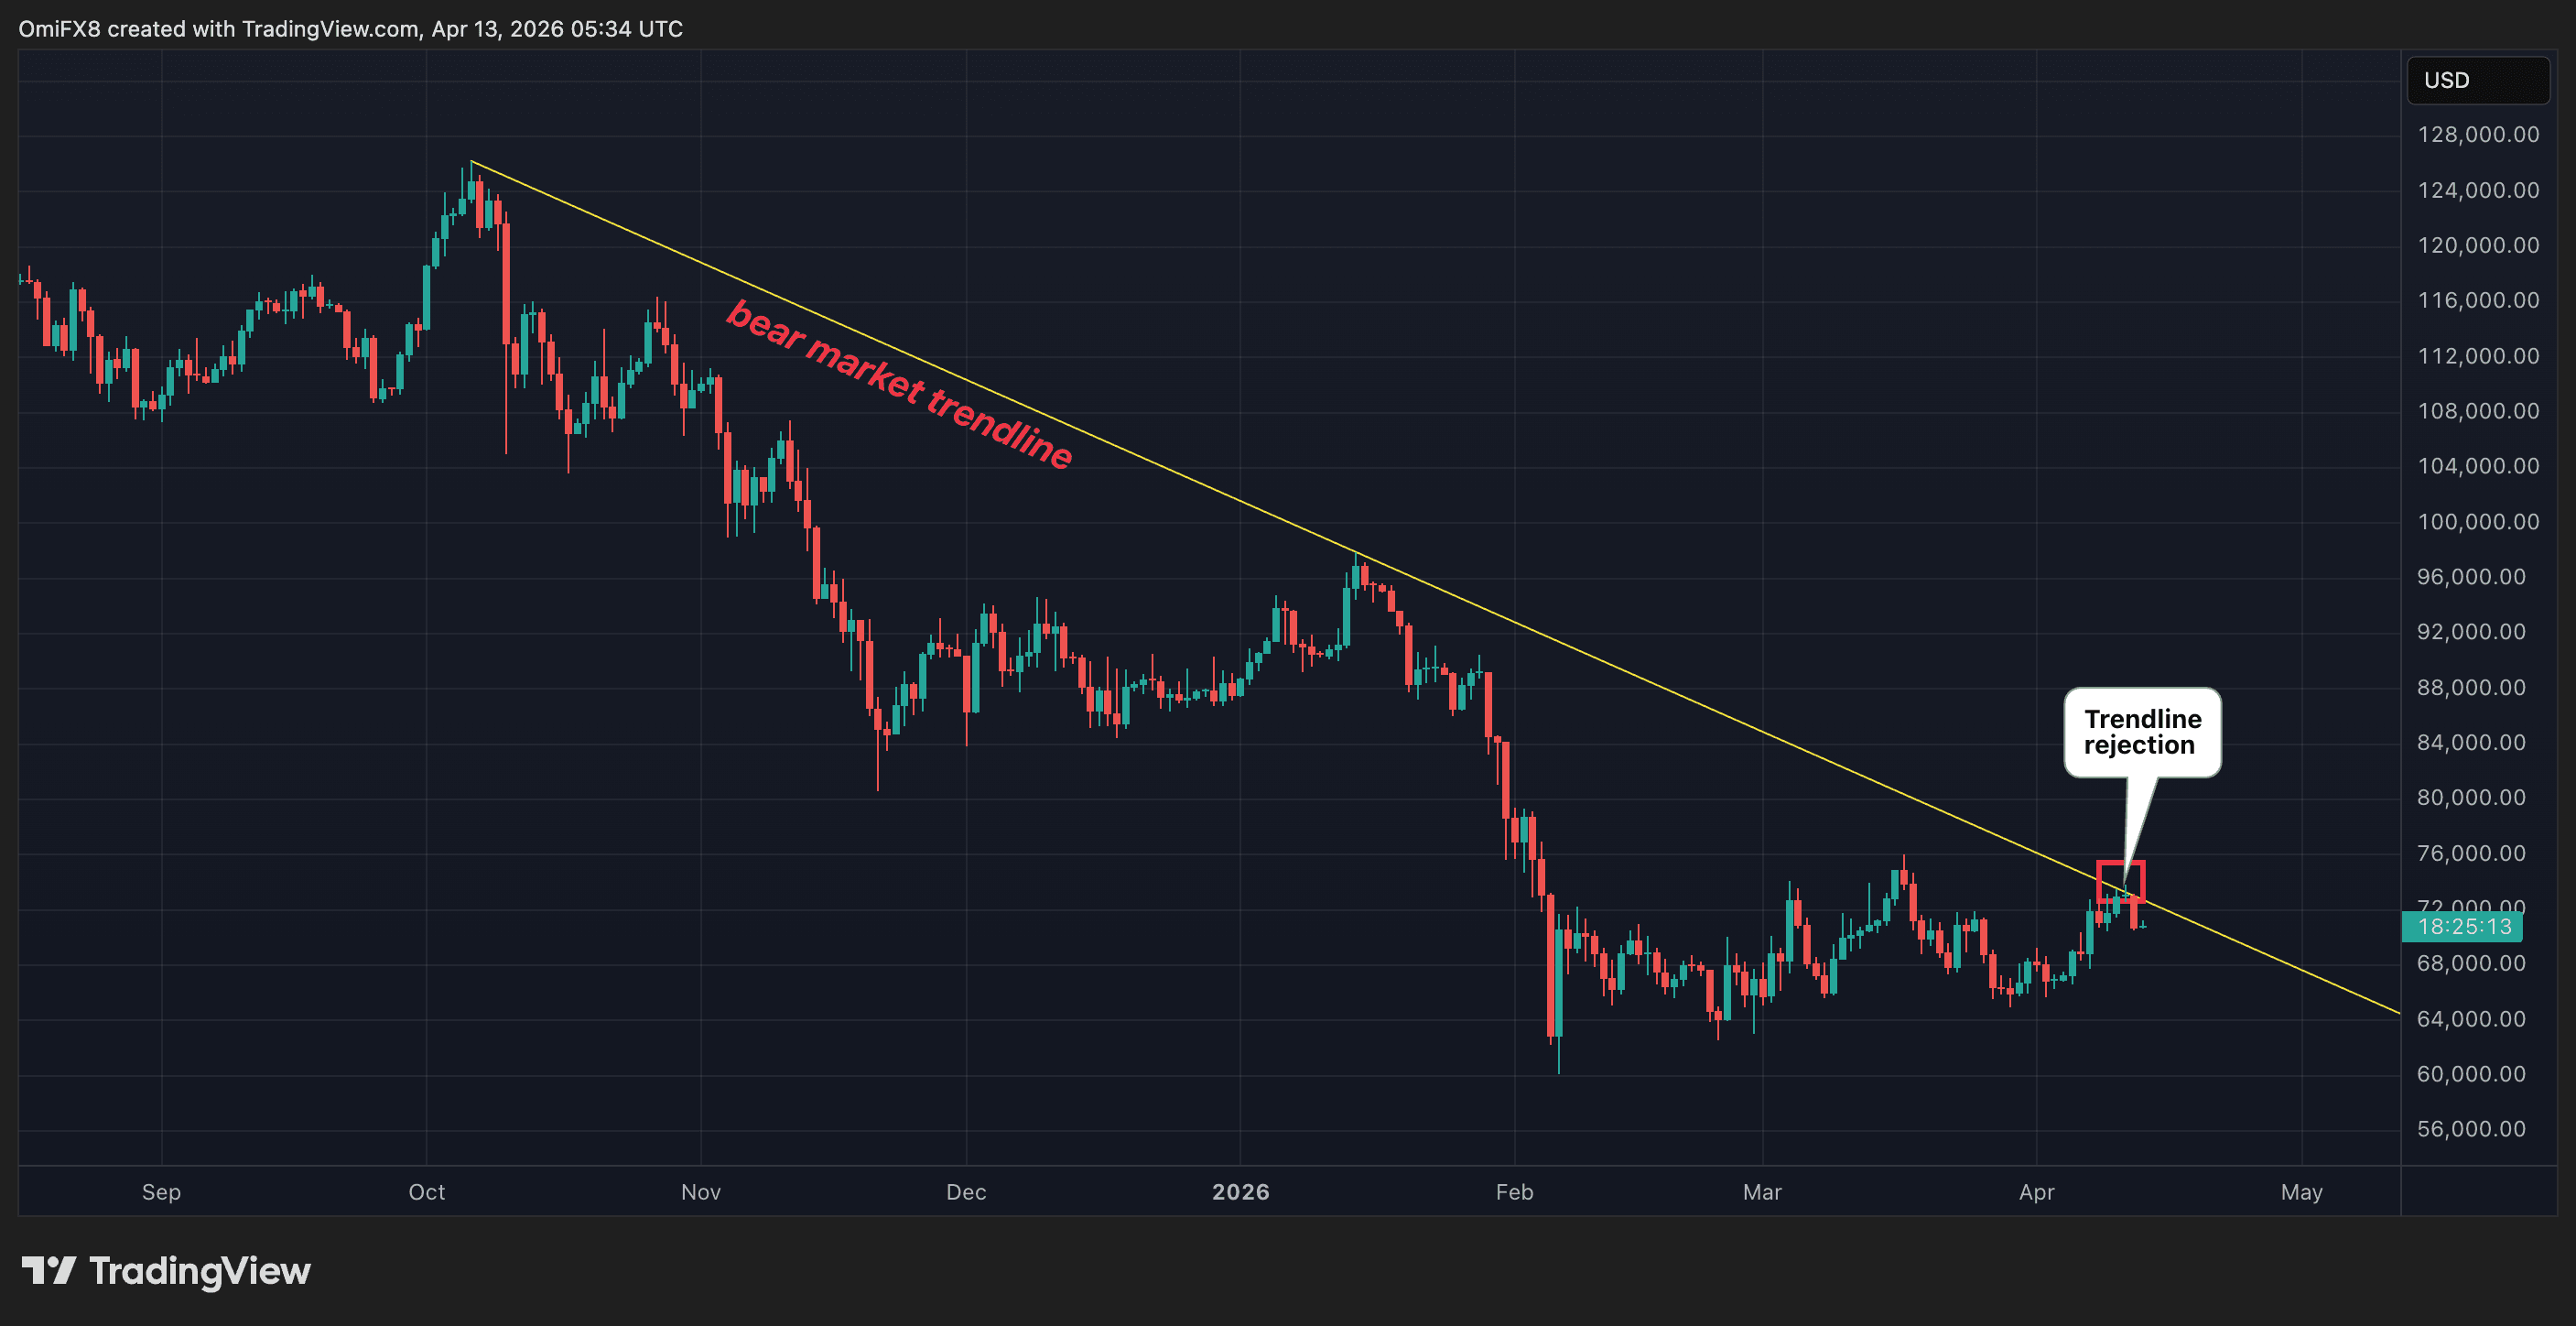
Bitcoin’s price has run directly into one of the most pivotal technical levels – a descending trendline that has been in place since October, when Bitcoin peaked above $126,000. And right on cue, the price has turned lower from the trendline resistance.
What is a descending trendline and why does it matter

A descending trendline is drawn by connecting a series of progressively lower price peaks over time. Think of a ball dropped from a great height: as it bounces, each rebound is lower than the last. Now imagine linking those lower highs with a straight line – that’s the descending trendline, capturing the fading strength behind each bounce.

In markets, this reflects diminishing buying power, with sellers increasingly asserting control over price action. The longer the trendline holds, and the more often price turns lower from it, the more significant it becomes, signaling a sustained bear phase.

In bitcoin’s case, this particular trendline has been sloping downward since the $126,000 peak in October 2025. That’s roughly six months of lower highs and six months of the market telling you: the trend is down.

This is what traders call a textbook bear market trendline.

The rejection

Since early February, bitcoin has rallied from nearly $60,000 to over $71,000. The sounds bullish on the surface, and in isolation, it is. But zoom out, and you will see immediately that this is a recovery rally within the broader downtrend represented by the descending trendline.

That trendline was tested overnight, and since then, prices have turned lower. This is what aficionados of technical analysis call a trendline rejection, and it means that sellers have overpowered buyers exactly where the bear-market trendline predicted they would.

The market probed resistance, found it, and turned back. Until $BTC can close above this trendline on meaningful volume — not just poke through it intraday — this line remains in control, and the broader downtrend remains intact.

Fundamentals tell you what should happen, and analysts on Sunday cited several fundamental datasets, such as Coinbase premium ETF inflows and macro, as catalysts for a rally to $88,000.

However, the price chart tells you what is happening, and right now, the textbook rejection at the six-month bear market trendline is signalling caution for the bulls.

What to Watch From Here

The trendline is the key variable, based on which two scenarios could unfold.

First, the latest rejection at the trendline invites stronger selling pressure, leading ot a deeper decline to $65,000.

The second scenario involves $BTC grinding back up, punching through the trendline. That would be a significant positive development, one that would start to align the chart with the bullish fundamental story.

Until the second scenario plays out, the chart and the bull case are telling two different stories.

Read the full article here

Bitcoin Bull case challenged chart Hits Wall
Share. Facebook Twitter Pinterest LinkedIn Tumblr Email Reddit Telegram WhatsApp

Related Articles

Amazon’s new Kindle case is an insult to my fellow lefties

CFTC opens path for true perpetual futures on US regulated exchanges

Bitcoin futures drop $1.4B, but spot buyers step in to help

Rain seeks U.S. trust bank amid crypto charter lawsuit

Nasdaq 100 hits another record as 10-year yield holds at 5.3%

Rain Applies for US Trust Bank Charter to Issue Stablecoins Under GENIUS Act

Gold hits two-month low as bears eye $4,100 break on firm USD

6 Continents Sound Alarm on Scams Targeting Investor Trust

Why Bitcoin Price Could Reclaim $100,000 This Year? Expert Reveals ‘Explosive Catalyst’

Editors Picks

Binance BTC outflows hit highest since mid-2023 as whales deposit stablecoins

October 6, 2026

Helping my cousins through caregiving is giving me a new perspective. I’m finally giving myself credit for caring for my mom.

October 6, 2026

Amazon’s new Kindle case is an insult to my fellow lefties

October 6, 2026

Why BTC consolidates near recent highs?

October 6, 2026

I’m the CEO of Zocdoc. Here’s how long showers help me manage hectic days.

October 6, 2026

Latest News

iFX EXPO Asia 2026 begins tomorrow as the global trading industry gathers in Hong Kong

October 6, 2026

CFTC opens path for true perpetual futures on US regulated exchanges

October 6, 2026

The crown jewel in Elon Musk’s empire

October 6, 2026

Subscribe to News

Get the latest market and politics news and updates directly to your inbox.

Advertisement
Demo
Facebook X (Twitter) Pinterest TikTok Instagram
© 2026 Political Risk Wire. All Rights Reserved.
  • Privacy Policy
  • Terms
  • Press Release
  • Advertise
  • Contact

Type above and press Enter to search. Press Esc to cancel.

Sign In or Register

Welcome Back!

Login to your account below.

Lost password?